
Reviving correlation
Almost a year ago a blog post appeared on Towards Data Science suggesting an alternative to the common correlation coefficient called the Predictive Power Score (PPS). The PPS is promoted for being able to measure nonlinear relationships (asymmetrically) for both numeric and categorical variables. Without going into the technical details behind the PPS algorithm, I was wondering whether an extension to the classic correlation setup couldn’t produce similar (or even better) results.
To extend the normal correlation coefficient, I relied on the related but less-known metric of multiple correlation. The multiple correlation coefficient is simply the square root of the coefficient of determination (here: adjusted) from an OLS regression on one or more covariates (features). This modest extension already allows to include categorical features (as dummies) and measure nonlinear relationships (for example, by using a polynomial functional form for a single feature). To address the problem of categorical targets (responses), I suggest to regress every single level and take the weighted average across all multiple correlation coefficients (a multinomial probit might be another option). To minimise computation time, a cardinality threshold can be defined. The original blog post compared the classic correlation matrix to the PPS matrix on the Titanic dataset (which can be downloaded from the Kaggle website). In this blog post, I’ll compare the multiple correlation matrix to the previously proposed PPS matrix. The code used can be found here.
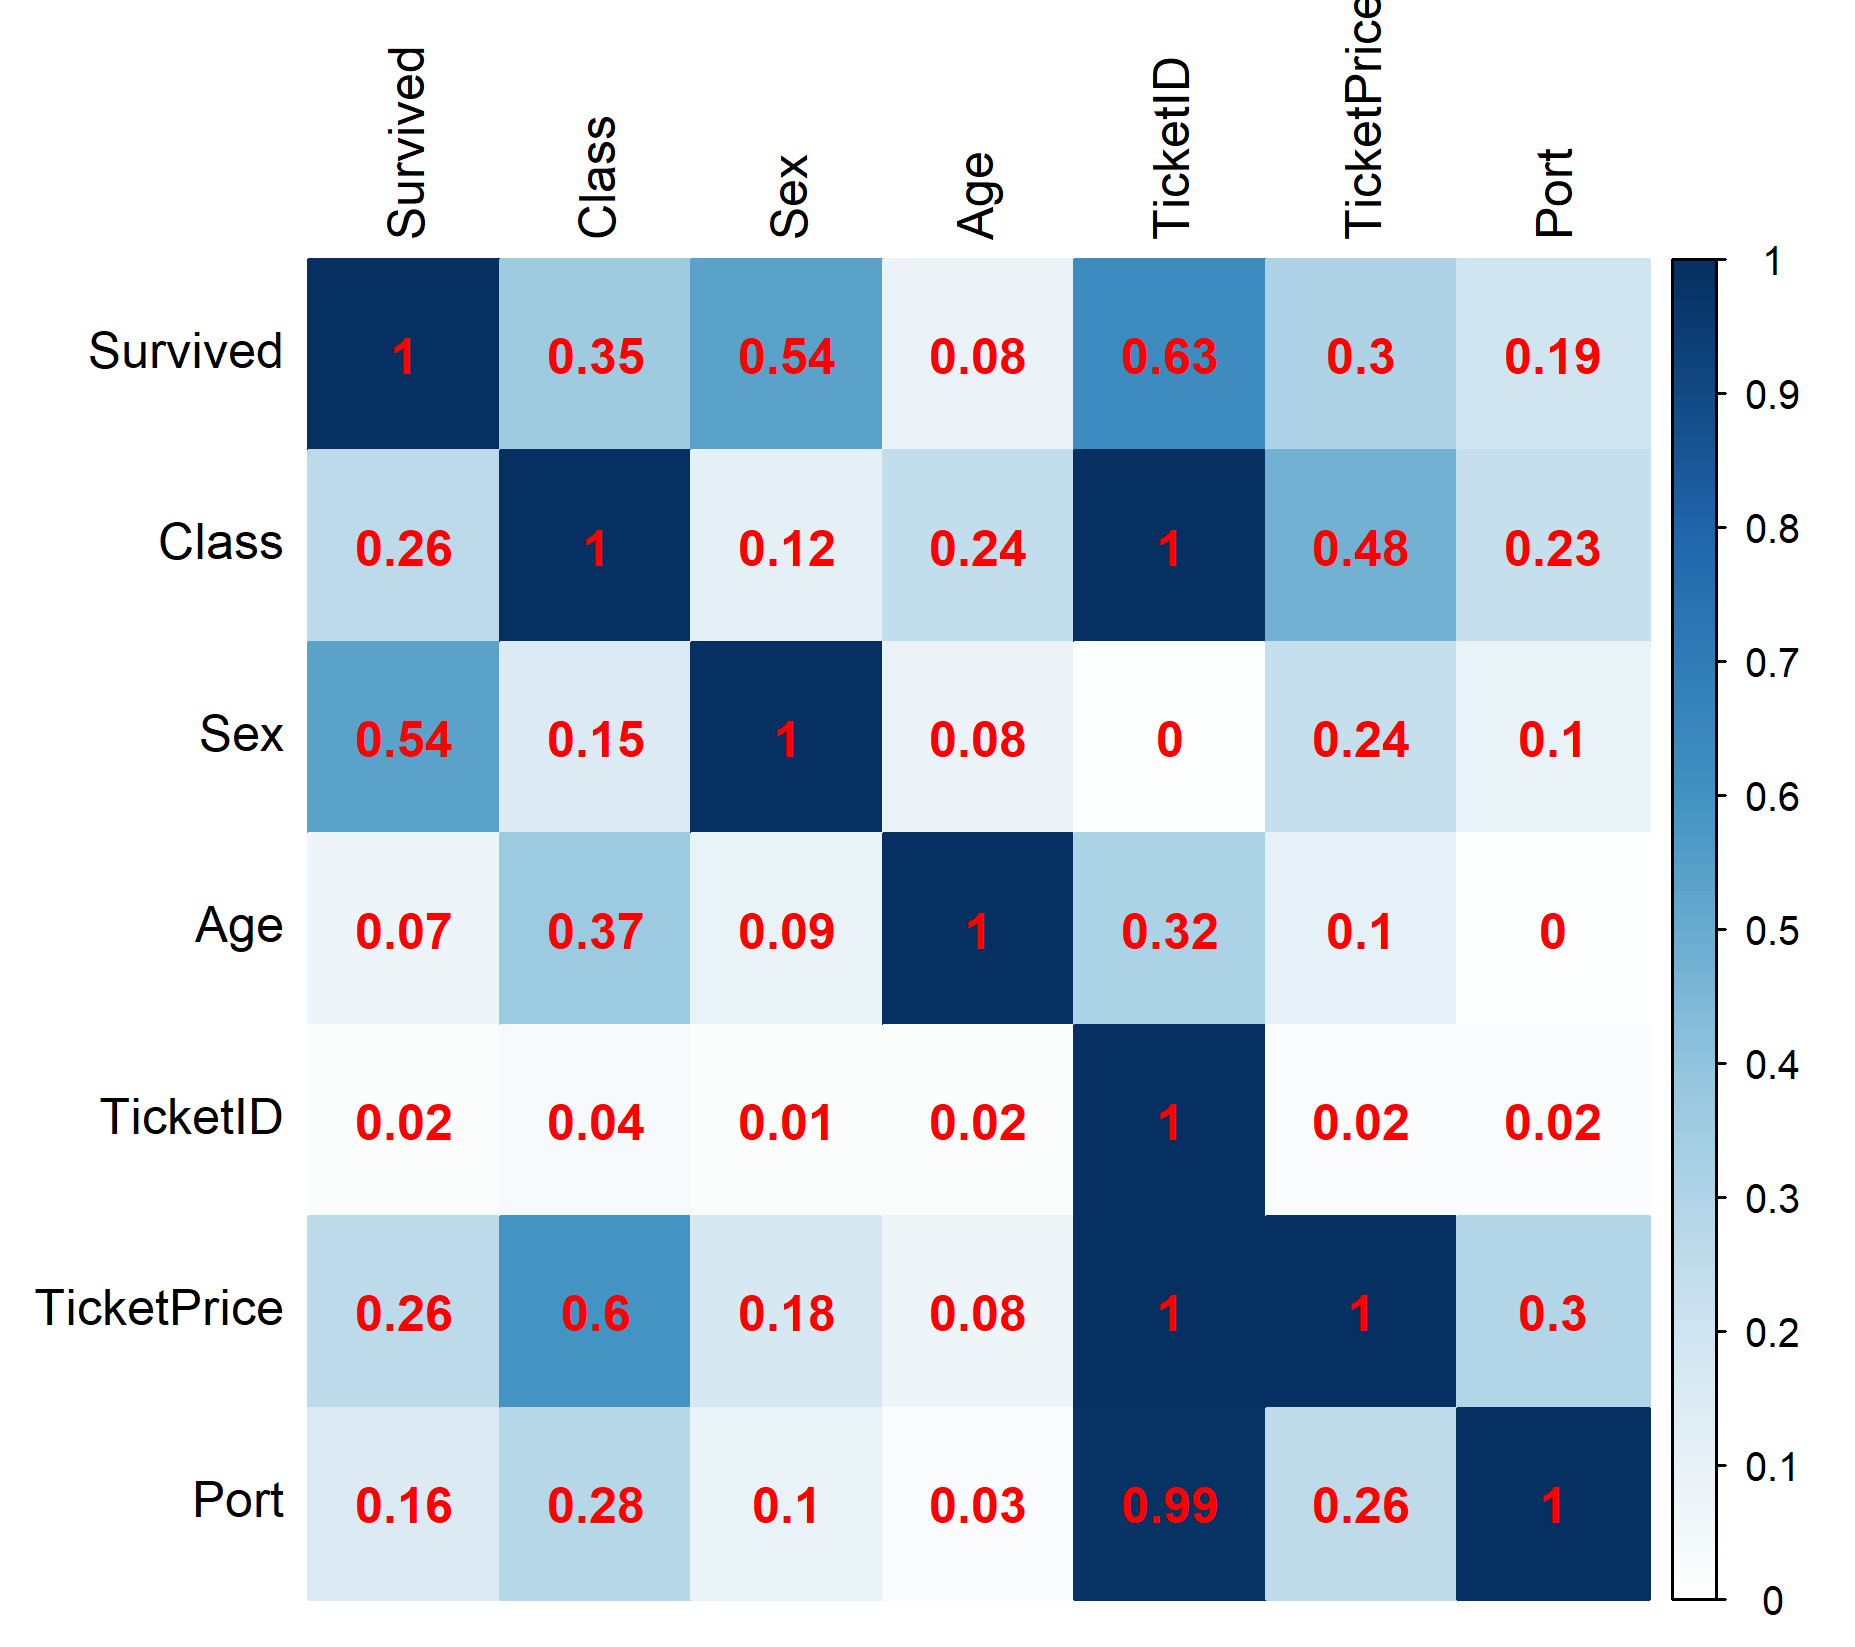
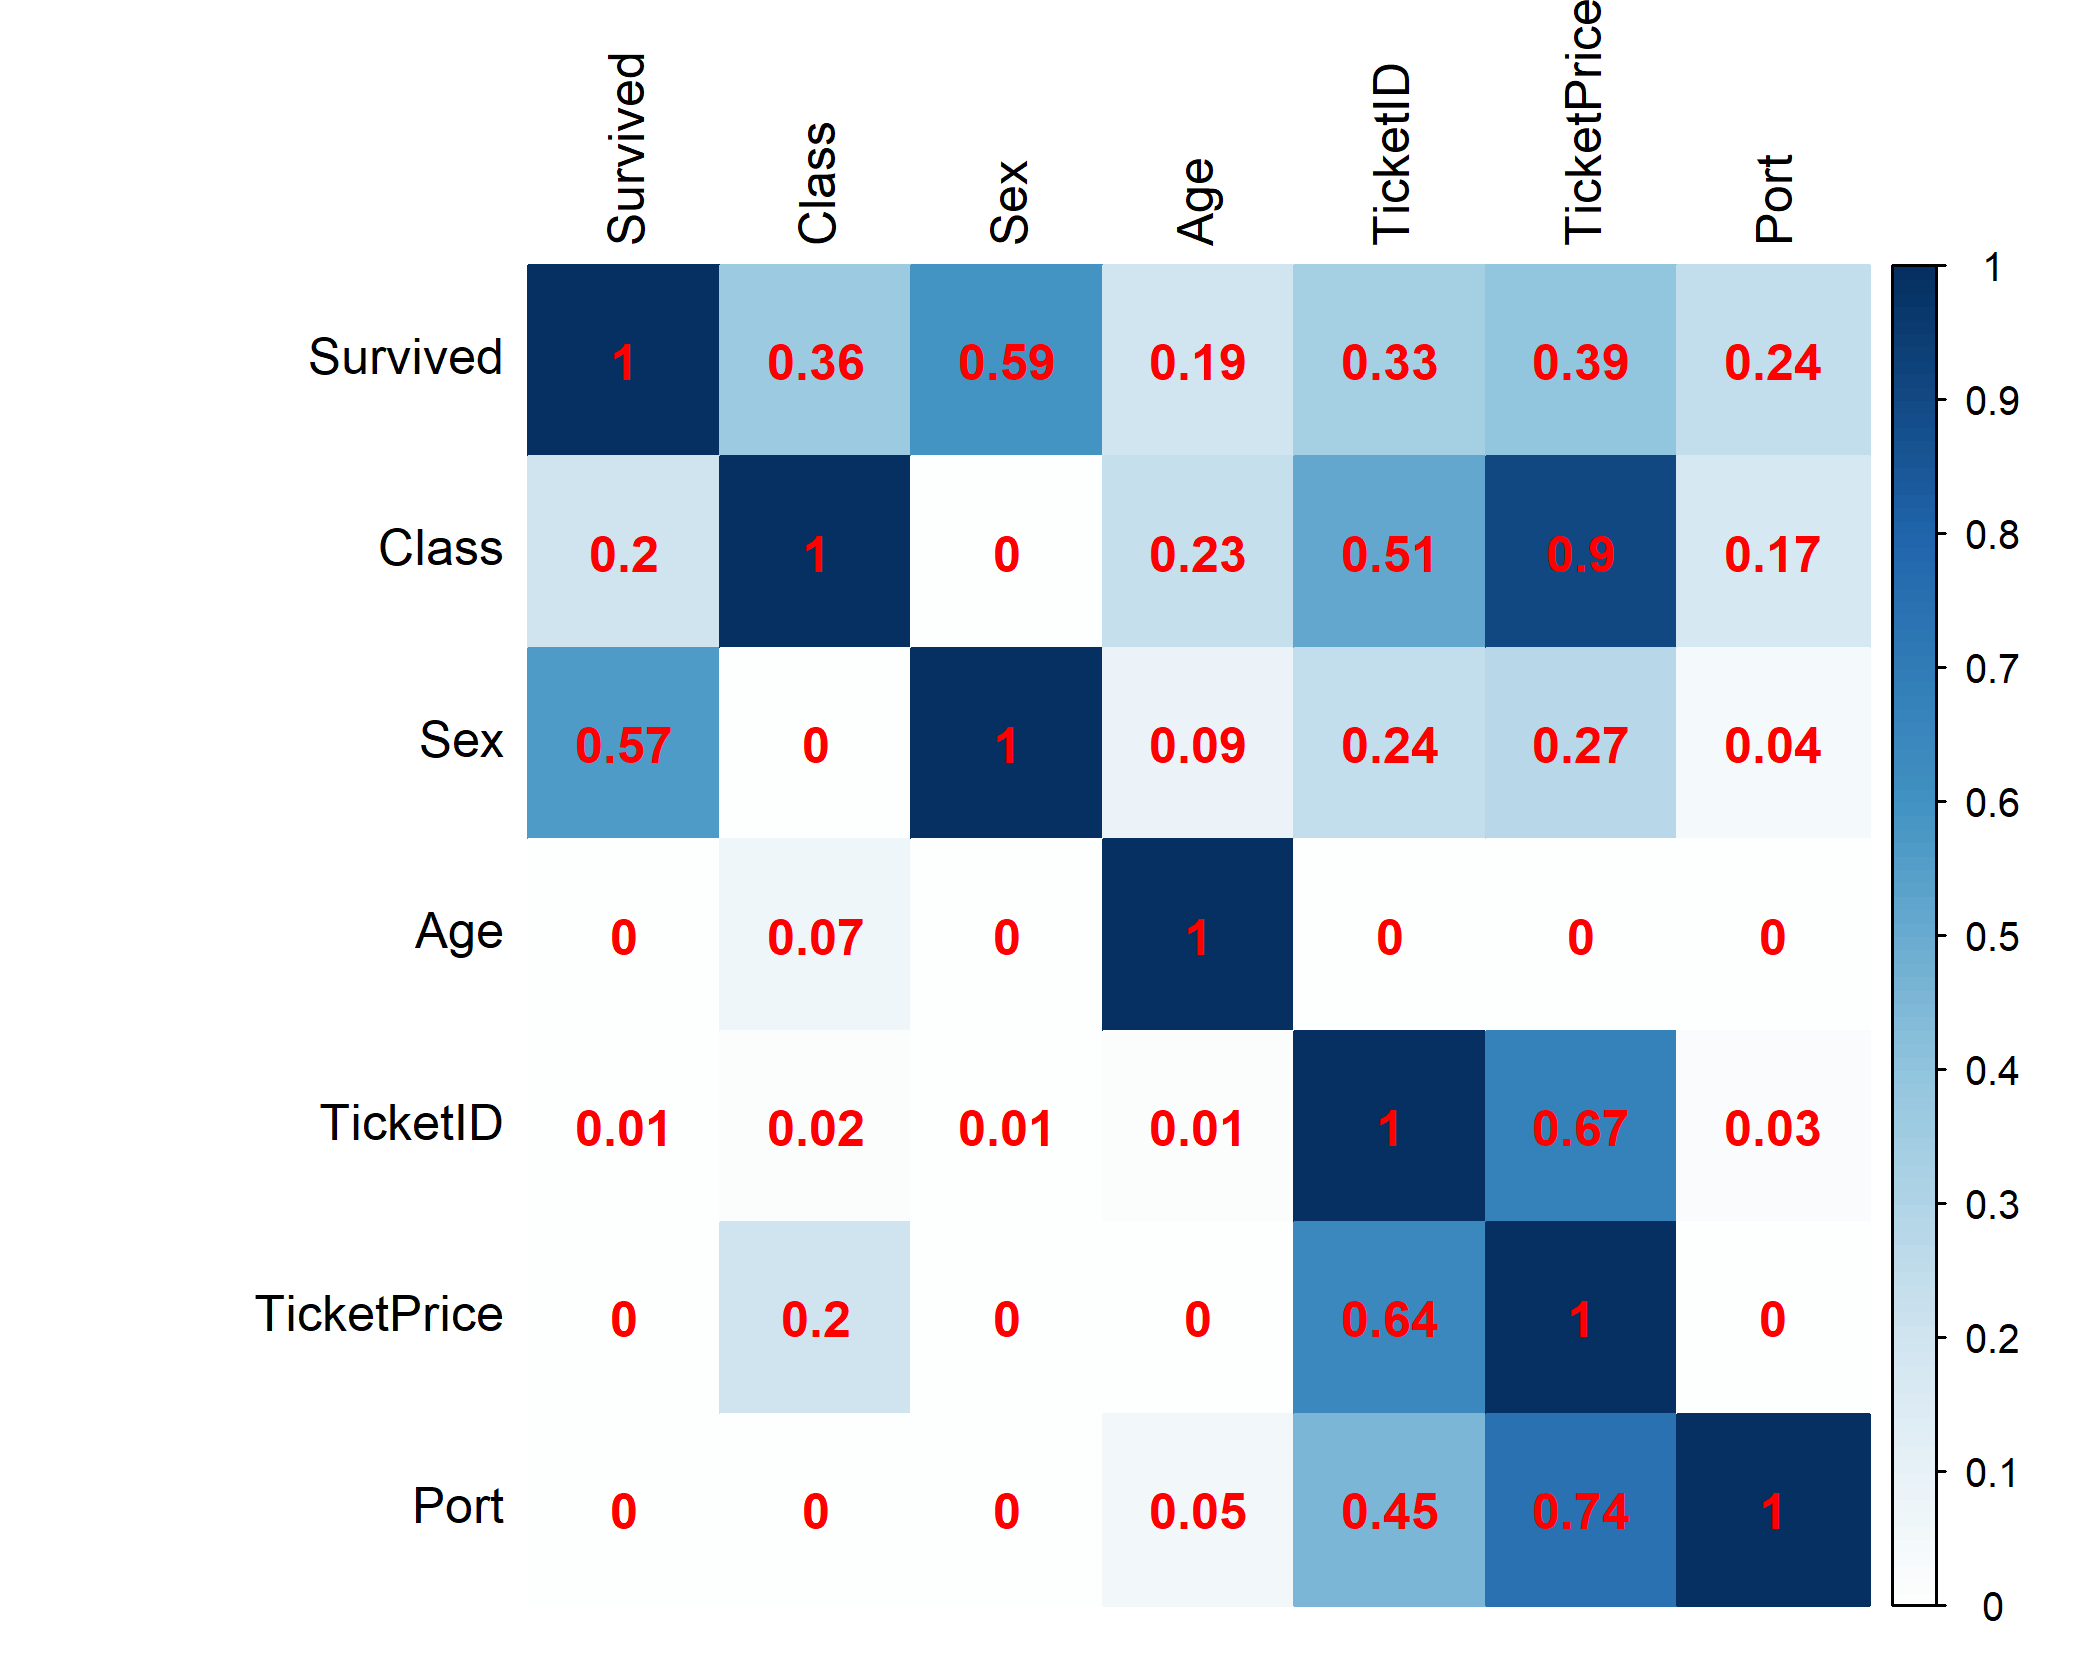
At first sight, both matrices seem to portray similar patterns. They both show gender to be a fairly strong predictor of survival, followed by class and tickets price and finally by age and port with a much smaller effect. Of all variables Ticket ID is the least associated with any of the features.
One of the biggest differences occurs for the variables Class and Ticket Price. The PPS matrix reports a large association when Class is the target and a fairly low value when Class is the feature. The multiple correlation matrix, on the other hand shows medium levels of association for both cases. How can this difference be explained? First of all, ticket prices show a large degree of variation by class. Although the average ticket price for first class is almost 7 times higher than for third class, the minimum value for both classes is zero! The entire range of ticket prices in third class (0-56) is subsumed in the first-class range. Therefore, a high price points strongly to first class, while being in first class seems no guarantee for high ticket prices. 0-1 PPS? Not exactly. While the dataset does contain free first-class tickets, these values are outliers: only 2% of first-class tickets is cheaper than the average third-class ticket. Given the amount of overlap between the classes, a 90 per cent association from Ticket Price to Class seems exaggerated while the 20 per cent association in the opposite direction hides substantial (averaged) differences among classes. In my opinion, the 48-60 per cent multiple correlation coefficients give a more honest picture of the association between class and ticket prices.
Another big difference can be observed for the feature Ticket Price. The multiple correlation matrix predicts far greater levels of association than the PPS matrix. To explain these differences, we need to look into what this variable actually represents. Unlike modern plane tickets, the Ticket ID codes for the Titanic are not unique (there are 541 unique codes for 712 observed travellers). Instead, it appears that Ticket ID identifies families or groups who purchased their tickets together (and presumably travelled together). Knowing this, the perfect prediction levels in the multiple correlation matrix make sense. Families or travel parties can be expected to board the Titanic using the same Port, travel in the same class and therefore pay the same ticket price (as I don’t know the other factors determining Ticket Price, I have to a assume they are similar for groups too). The variable Age is much less well-predicted by Ticket ID, which can be explained by the fact that couples were not necessarily of similar age (similar for non-family travel parties) and the fact that 10% of passengers on-board were children. Given the low share of children travelling, however, the complete lack of association using the PPS metric seems strange as it implies a random distribution of age across people travelling together. The lack of association between Sex (target) and Ticket ID (features) for both matrices likely points to the high presence of couples travelling, for whom the gender balance would be 50-50 making it impossible to predict. For everyone using categorical features, the high levels of prediction shouldn’t come as a surprise. With that many levels, almost everything can be predicted and in fact, not trimming categorical variables (when building models on training sets, for example) can be argued to be bad practice.
One weakness of the multiple correlation approach presented here are the low levels of association predicted for categorical outcomes (such as Port) and continuous features (such as Ticket Price). Decision trees (used by the PPS), on the other hand, are quite capable of detecting all sorts of nonlinear effects and can handle categorical outcomes naturally.
So in conclusion: has the classic correlation coefficients really become redundant? The PPS blog post rightly points to the need for a metric that is asymmetric, detects nonlinear effects and handles categorical outcomes. Whether the Predictive Power Score is the best way forward remains an open question. It is relatively complex (computationally and conceptually) and can return some quirky results. Besides, the multiple correlation coefficients already carries you a long way, as this articles tries to argue. However, if you’re interested in categorical outcomes, a decision tree-based approach might be your best option.